Part 3: Debugging React Performance — Measure Before You Optimize
July 16, 2025
 Ashish Gogula
July 16, 2025
Ashish Gogula
Before you dive into optimizing React, let’s be honest — most performance problems come from guessing what’s slow instead of measuring it.
In this final part of the series, we’ll walk through how to actually see what's happening under the hood of your app, using tools like React DevTools Profiler and why-did-you-render
But first — if you haven’t read the earlier parts of this series, I recommend starting there:
Part 1: React Rendering Demystified — What Actually Causes Re-Renders (opens in new tab)
Part 2: Optimizing React Re-renders — Memoization and Smarter Components (opens in new tab)
Both will give you the context you need to understand why your app might be rendering more than it should.
It’s tempting to wrap everything in React.memo or use useCallback everywhere — but unless you actually know what’s slow, you might just add complexity without any gain.
React is already fast. Your job is to find out:
That’s where the right tools come in.
React DevTools comes with a Profiler tab that tells you exactly:
You’ll see which components took the longest to render and how often they re-rendered.
💡 Look for:
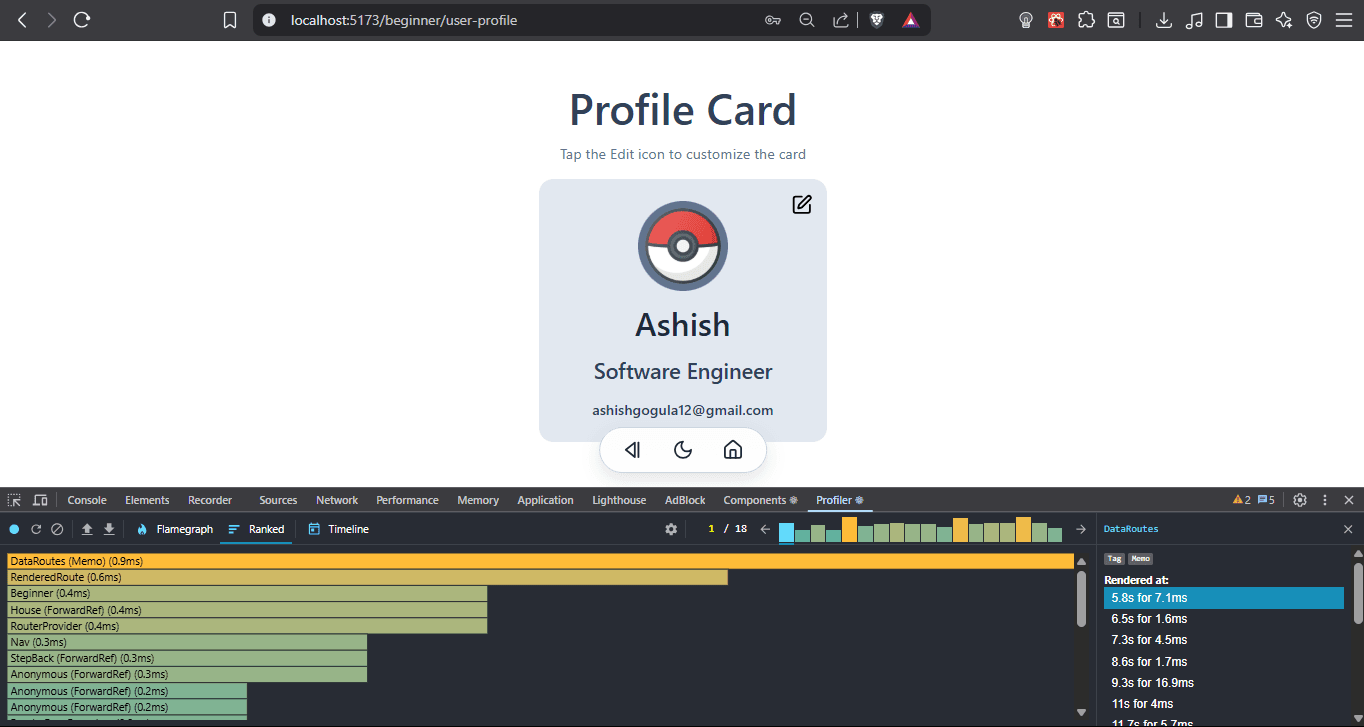
This image shows the React DevTools Profiler in action, specifically highlighting the "Ranked" view. This view is your first stop because it lists components by how long they took to render, making it easy to spot potential bottlenecks.
In the yellow-orange bar at the top of the Profiler, you'll see a count like 1 / 18. This tells us we're looking at the 1st render out of a total of 18 times our components updated during this recording session. Seeing a high number of renders can be an immediate flag that your app might be re-rendering more often than necessary!
On the left, you see horizontal bars representing your components, with their render times in milliseconds (e.g., DataRouter (Memo) 0.9ms). Longer bars and higher ms values indicate components that are taking more time.
The right sidebar provides insights like the total render duration for this update (Render: 7.1ms) and, crucially, "What caused this update?". This helps you understand why a render happened, which is key to preventing unnecessary re-renders.
Here’s an excellent walkthrough by Kyle Simpson where he explains how to interpret flame graphs and track down slow components visually.
Watch: How To Maximize Performance In Your React Apps (opens in new tab)
Sometimes, all you need is a simple log:
console.log('Component X rendered');Even better, make a custom hook for it:
function useRenderLog(name) {
  useEffect(() => {
    console.log(`${name} rendered`);
  });
}
Use the hook in your component:
function MyComponent() {
  useRenderLog("MyComponent");
  return <div>Hello</div>;
}
This helps you visually track render frequency without diving into Profiler every time.
why-did-you-render is a small dev-only library that logs unnecessary re-renders to your browser’s console.
It watches your components and tells you if something re-rendered without any actual prop changes.
Think of it like a smart assistant whispering:
“Hey, this component re-rendered but nothing really changed. Maybe you can optimize it?”
npm install @welldone-software/why-did-you-render2. Enable it in development mode (usually in index.js or main.jsx):
import React from 'react';

if (process.env.NODE_ENV === 'development') {
  const whyDidYouRender = require('@welldone-software/why-did-you-render');
  whyDidYouRender(React, {
    trackAllPureComponents: true,
  });
}
3.Wrap your components in React.memo() to let React skip renders if props haven’t changed:
const MyComponent = React.memo((props) => {
  return <div>{props.name}</div>;
});

// Tell WDYR to track this
MyComponent.whyDidYouRender = true;
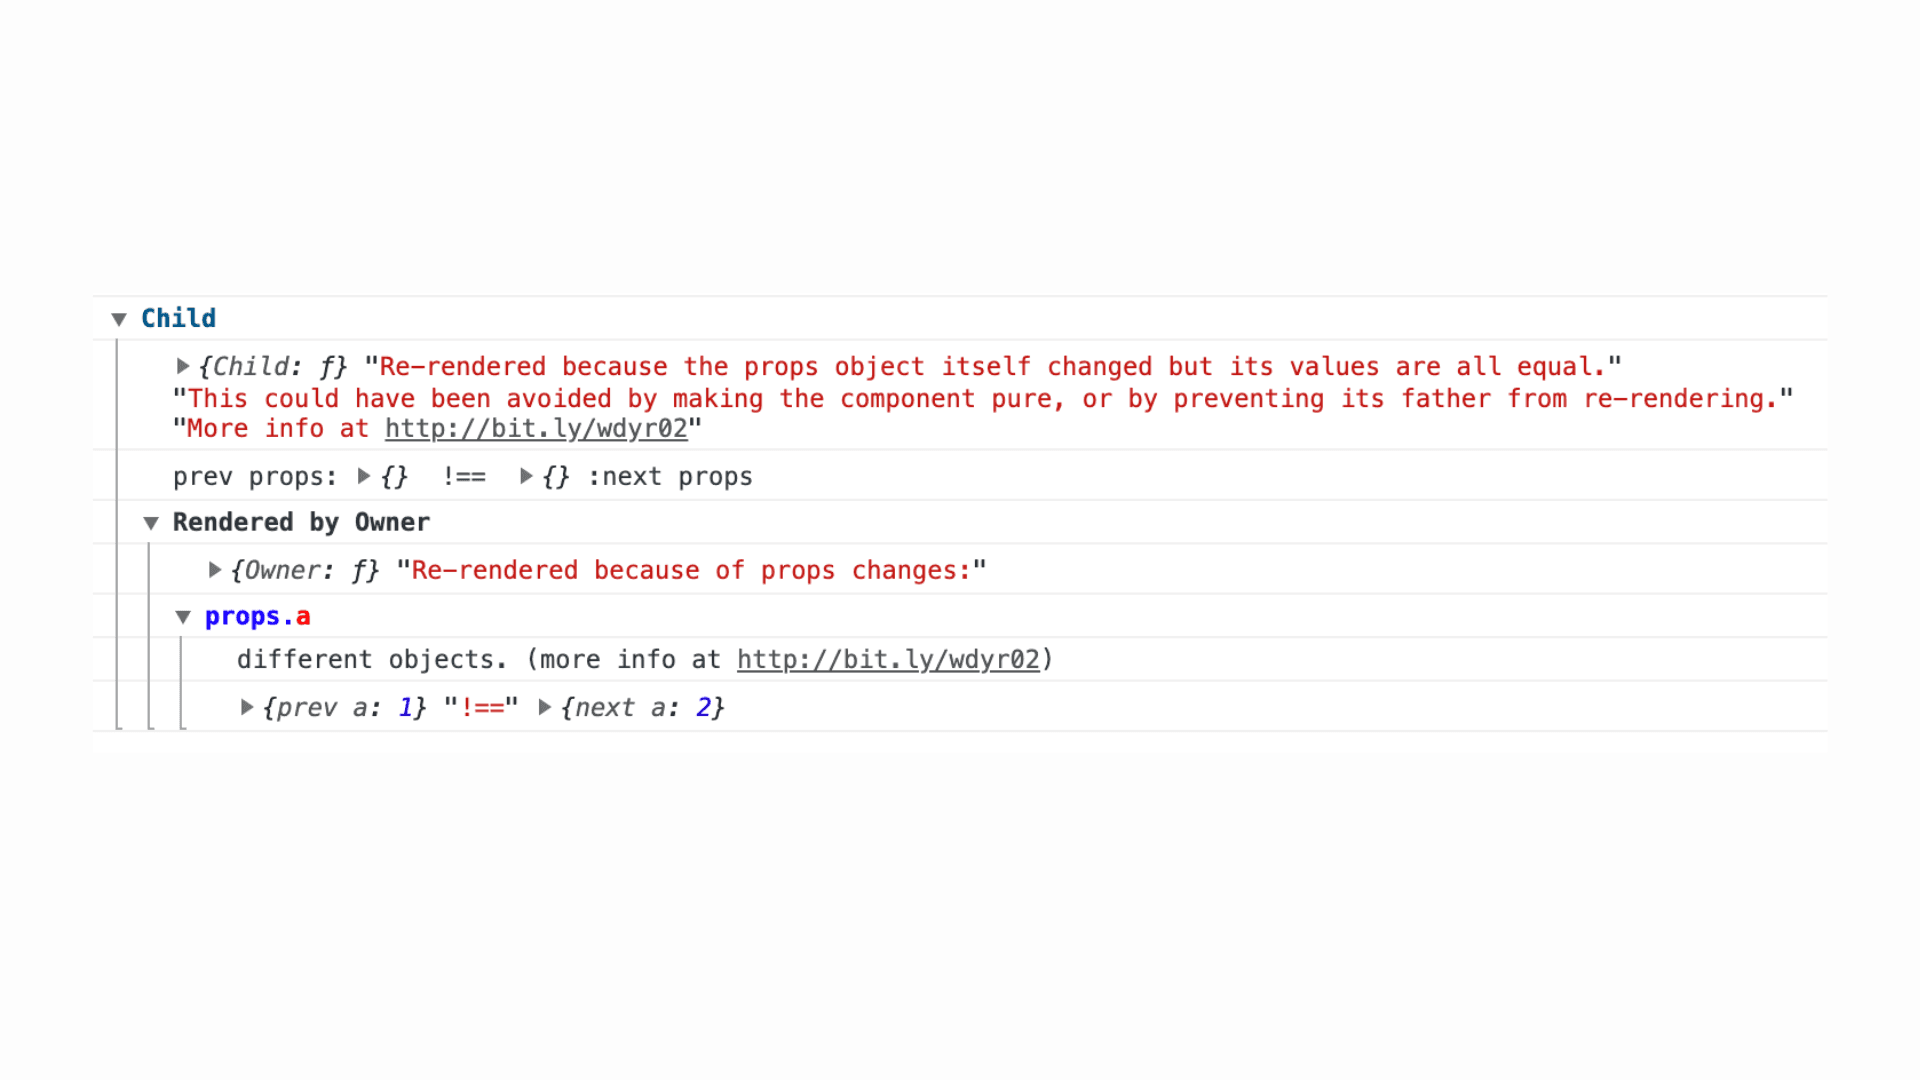
Now, when MyComponent re-renders without a reason, WDYR will log something like this in the console:
[why-did-you-render] MyComponent re-rendered unnecessarily.Here’s what it looks like in action:
Check out the full documentation here: why-did-you-render on GitHub (opens in new tab)
Look out for patterns like:
Once spotted, you can:
Sometimes the re-renders are caused by data fetching, not just state changes.
Use the Network tab in DevTools to check if:
To fix this:
Me watching the profiler record 32 re-renders for no reason

That’s the end of this 3-part series on React performance.
If you made it this far, you now know:
If you’ve used any of these techniques in your projects, or found a bug the Profiler helped uncover — I’d love to hear about it!